Taylor Hughes · 14 September 2026
Reimagining User Engagement Metrics for Subscription-Based Digital Services
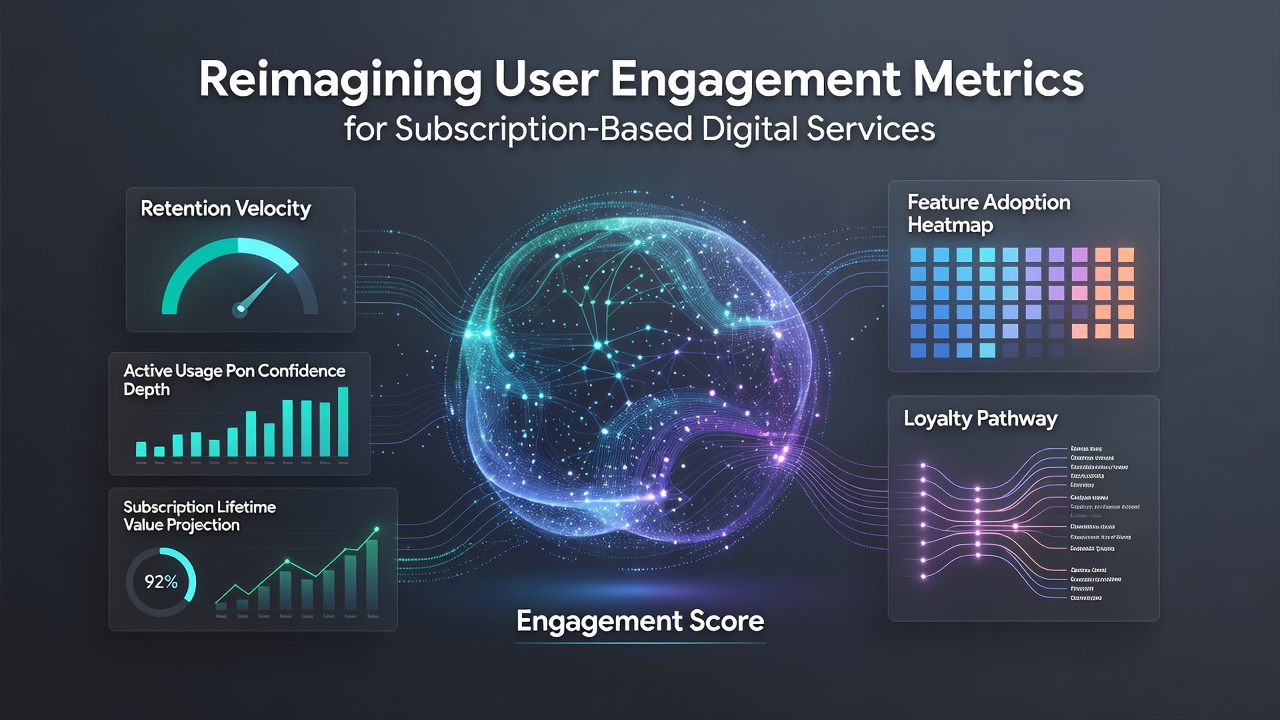
Subscription-based digital services have shifted how companies measure success because traditional metrics often fail to capture the full picture of user behavior over extended periods and multiple touchpoints and this has prompted researchers and analysts to develop more nuanced approaches that combine behavioral data with predictive indicators while accounting for variables such as content consumption frequency and feature adoption rates.
Traditional Metrics and Their Limitations
Daily active users and monthly active users have long served as foundational benchmarks yet these numbers frequently mask underlying issues with retention because a high DAU figure can coexist with rising churn when new signups offset cancellations and analysts note that churn rate calculations sometimes overlook the timing of cancellations within billing cycles which distorts lifetime value projections. Average revenue per user provides another snapshot but it rarely incorporates engagement depth such as session duration or interaction quality and studies from academic institutions reveal that services relying solely on these figures experience blind spots when users remain subscribed without meaningful activity.
Those who have examined subscription platforms across regions observe that metrics like customer acquisition cost must be weighed against long-term patterns and this becomes especially clear when seasonal fluctuations affect signups in markets tracked by organizations such as the Australian Competition and Consumer Commission.
Emerging Approaches to Measurement
Modern frameworks emphasize engagement quality through composite scores that blend recency, frequency and monetary value with behavioral signals like feature usage sequences and notification response rates and data from industry reports indicates these layered metrics help identify at-risk subscribers earlier than conventional methods alone. Predictive models now incorporate machine learning to forecast renewal likelihood based on usage curves and one study from the University of Toronto found that incorporating sentiment analysis from support interactions improved prediction accuracy by highlighting subtle dissatisfaction trends before they translated into cancellations.
What's interesting is how cohort analysis has evolved to segment users not just by acquisition channel but by engagement velocity which allows teams to compare groups that adopt core features within the first week against those who delay and this approach reveals retention differences that aggregate numbers obscure. In September 2026 observers expect updated guidelines from the European Data Protection Board to influence how platforms collect and apply these granular signals while maintaining compliance standards that vary by jurisdiction.
Case Examples from Digital Services
Take streaming platforms where watch time alone no longer suffices because algorithms now track completion rates across genres and cross-device consistency and experts have noted that services integrating these details adjust recommendation engines more effectively which in turn supports steadier subscription continuity. SaaS tools similarly benefit when metrics expand to include workflow completion percentages and integration usage and researchers discovered that teams monitoring these elements reduced involuntary churn linked to underutilization.
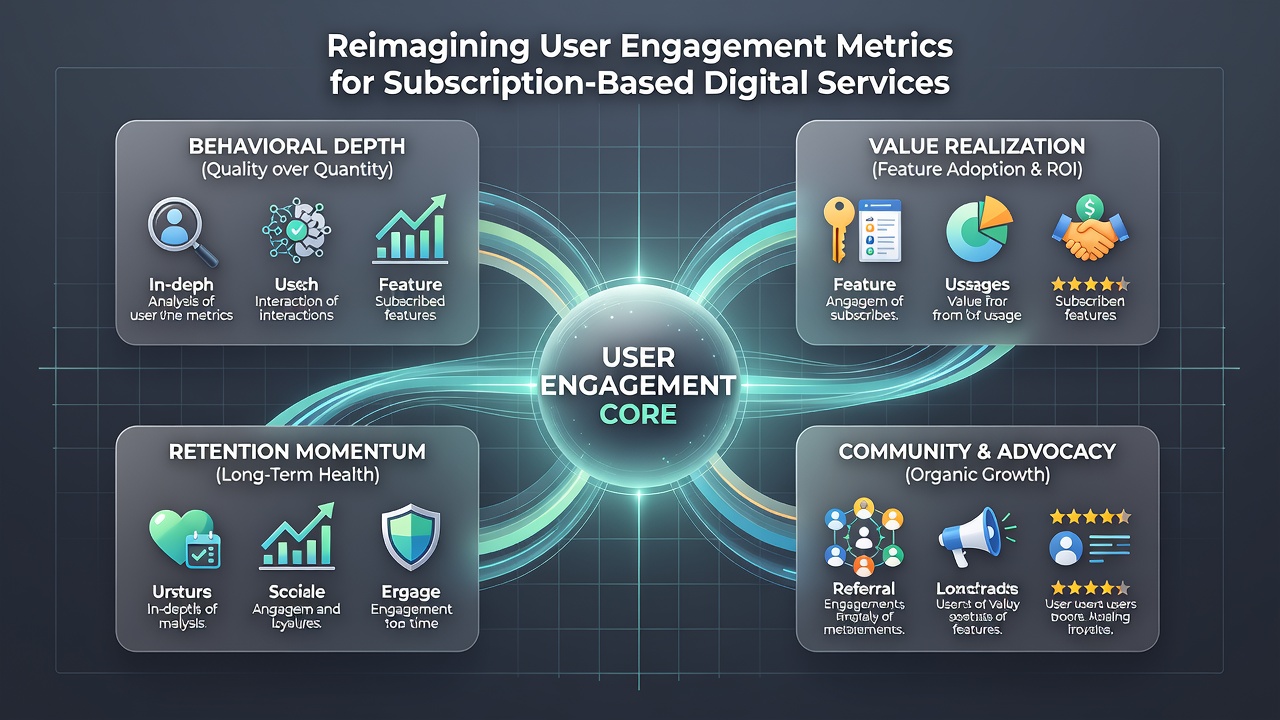
People who've analyzed fitness subscription apps report that metrics combining streak maintenance with community participation offer clearer signals than step counts or calorie logs in isolation and this layered view helps platforms intervene with targeted prompts that sustain activity levels over months rather than weeks.
Implementation Considerations Across Regions
Regulatory environments shape metric design because privacy rules in different areas dictate the scope of data collection and the OECD has published frameworks that encourage transparent reporting of engagement indicators without compromising user consent requirements. Companies operating internationally often standardize core calculations while adapting secondary variables to local expectations and this practice reduces compliance friction while preserving comparability across markets.
Yet the reality is that small and medium services face resource constraints when adopting advanced analytics tools and many begin by enhancing existing dashboards with additional event tracking before scaling to full predictive systems. Observers note that gradual integration allows teams to validate new metrics against historical data which builds internal confidence in the revised measurement approach.
Conclusion
Reimagining engagement metrics for subscription services involves combining established indicators with behavioral and predictive layers to create a more complete view of user relationships and this evolution continues as platforms respond to both technological capabilities and regulatory developments. Data shows that organizations adopting these expanded measures gain earlier visibility into retention risks while researchers continue to refine models that balance accuracy with privacy considerations across global operations.